Our Impact

We are driving change through partnerships and respect
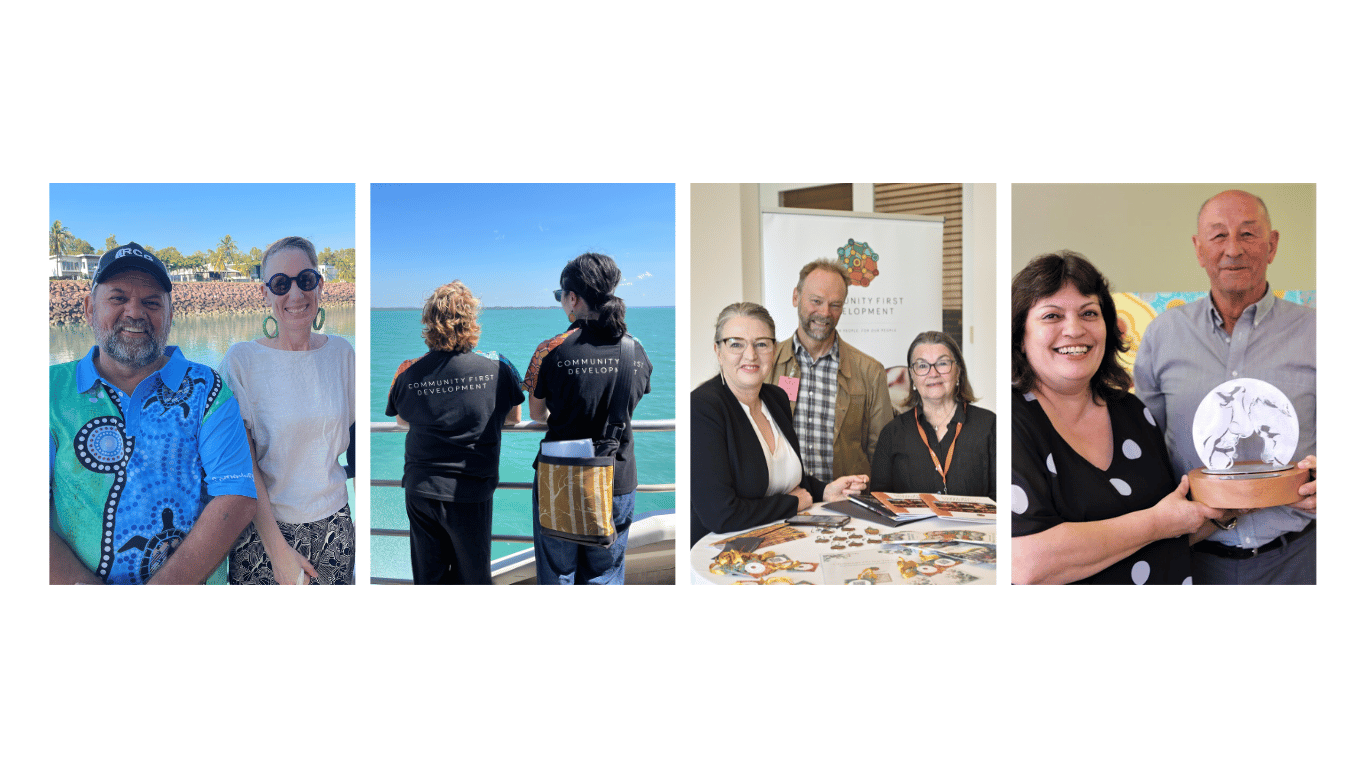
Four groups of people participating in outdoor and indoor activities, including a shoreline, a meeting table, and a trophy presentation.

“I feel like since I’ve been working with Community First Development and Carmen [volunteer] I can actually now see into the future with my business.”

- Community partner, Warren, Owner of RDK All Rounder Program

How we create change

A stylized orange and brown ladybug with black outlines, accompanied by the text 'BY INVITATION ONLY' below.

We do things with First Nations people, not to or for them. Communities invite us to assist them achieve their own goals.
A graphic with a circular, teal-colored logo that says "100% Community Driven" inside the circle. Below the logo, the phrase "100% Community Driven" is written again in black text.

Projects are 100% community driven. We give people control of development decisions and we respect local knowledge.
Illustration of three hands of different skin tones reaching towards each other inside a circle, with the words "Practical Support" written below.

Our national network of skilled volunteers provide practical support where skills and resources are limited.
A circular logo with a blue target-like symbol and dots around it, with the words 'PROVEN IMPACT' beneath.

Through identifying, monitoring and measuring outcomes, our projects and partnerships with communities show proven impact over time.

Our unique model works

Impact in action

Community First Development shares how they support First Nations communities — working with them (not to or for them) — to help achieve locally defined goals. Hear stories of collaboration, respect, and community-led progress, and learn what it means to be “by invitation only.”
Text-based graphic with the words 'Our Stories Are Woven Together' in bold, colorful font.

Watch this short film to see our
community partners in action.
Title slide with the text "Indigenous Women in Trades" in bold, gold-colored font on a white background.

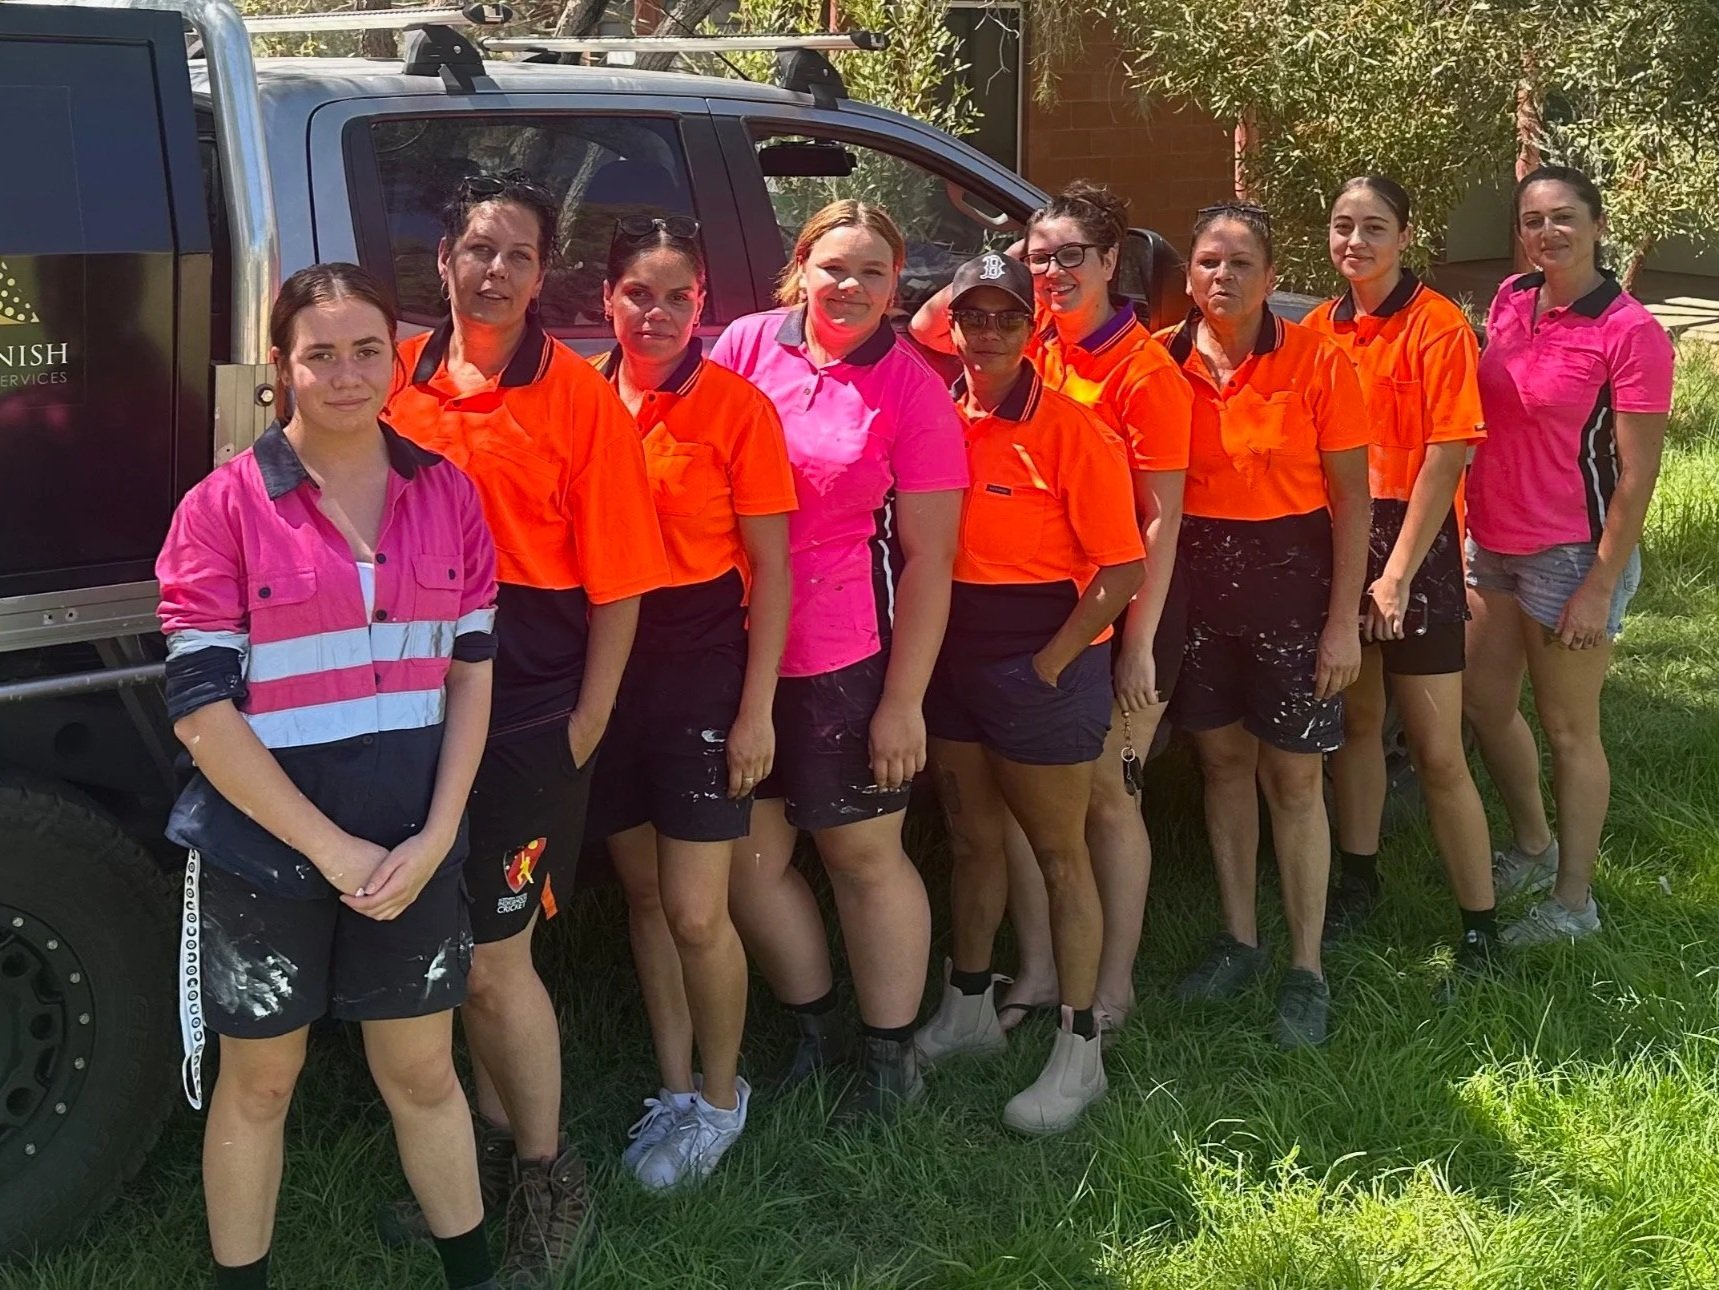
Irene Stanley is a business owner and founder of painting business, First Class Finish, in Ipswich and Brisbane. Irene mentors and employs Indigenous women through trade certification in painting.

Looking to expand this vision to more trades, she invited Community First Development to walk alongside her to develop a website, create a business and strategic plan, and secure funding for additional training.

Each year we work with 100’s of First Nations’ individuals, enterprises and communities across Australia who are achieving great things, like Irene and Indigenous Women in Trades.
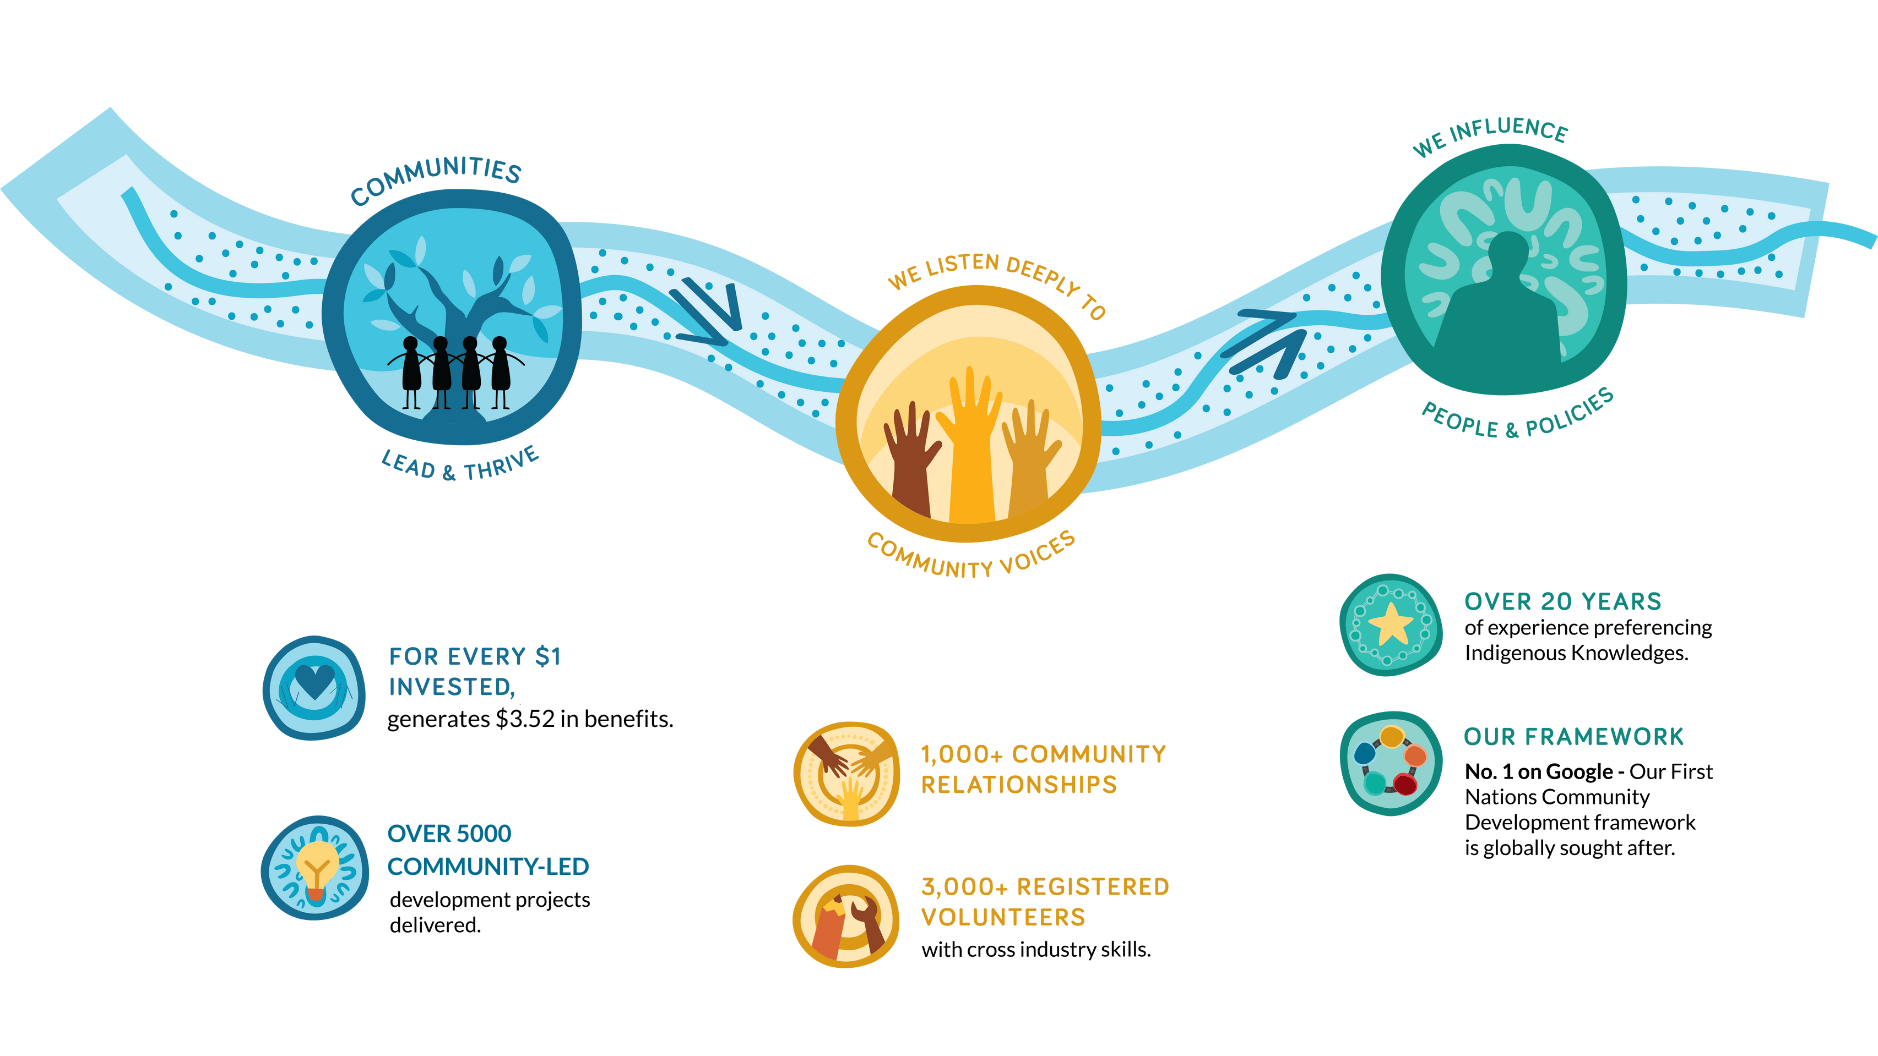
Text on a white background states: "Our approach to working with communities shows the power of supporting local First Nations' leadership and listening deeply to influence change."
A graphic illustrating a community development infographic with icons and text about community impact, organization, and collaboration.

Want to dive deeper?

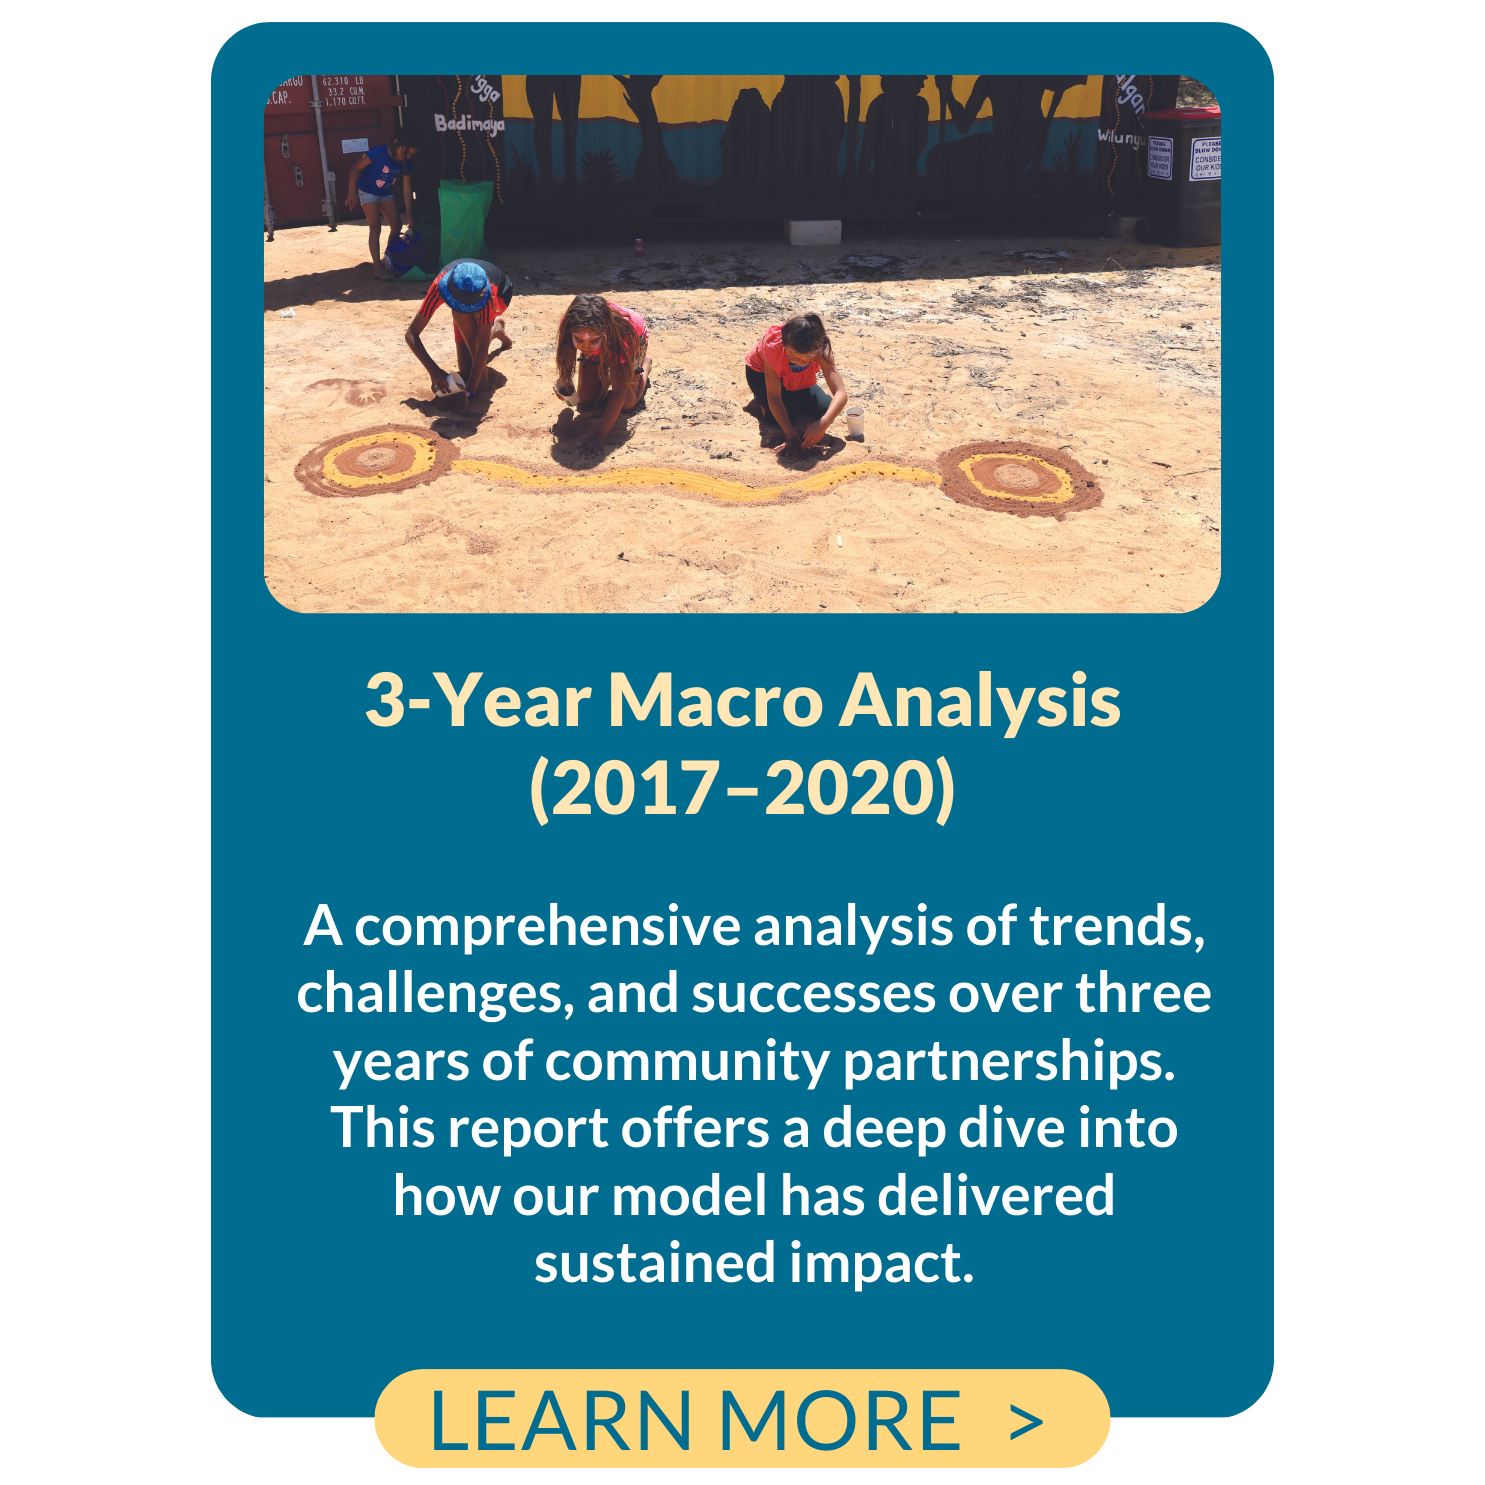
Explore our reports
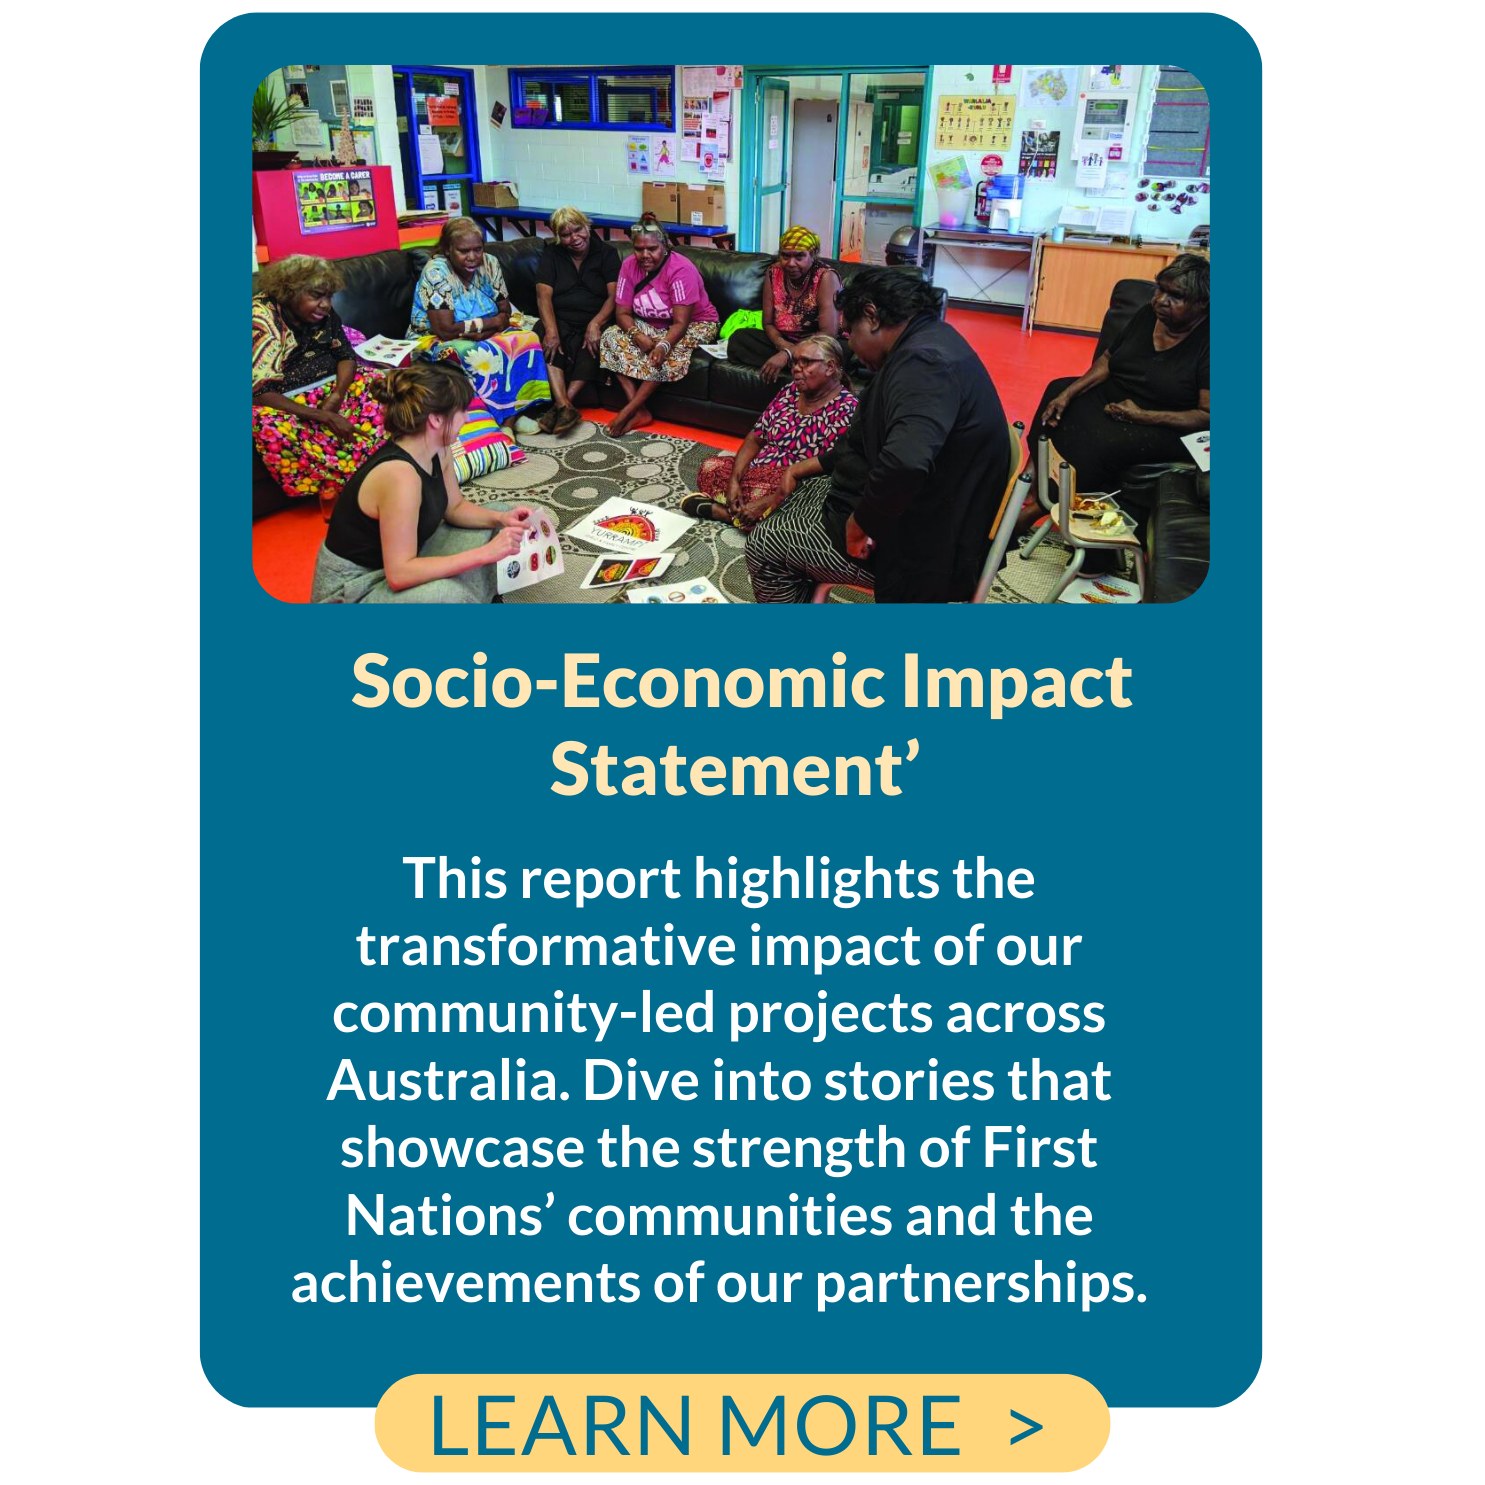
Why support out work?

At Community First Development, every dollar counts.
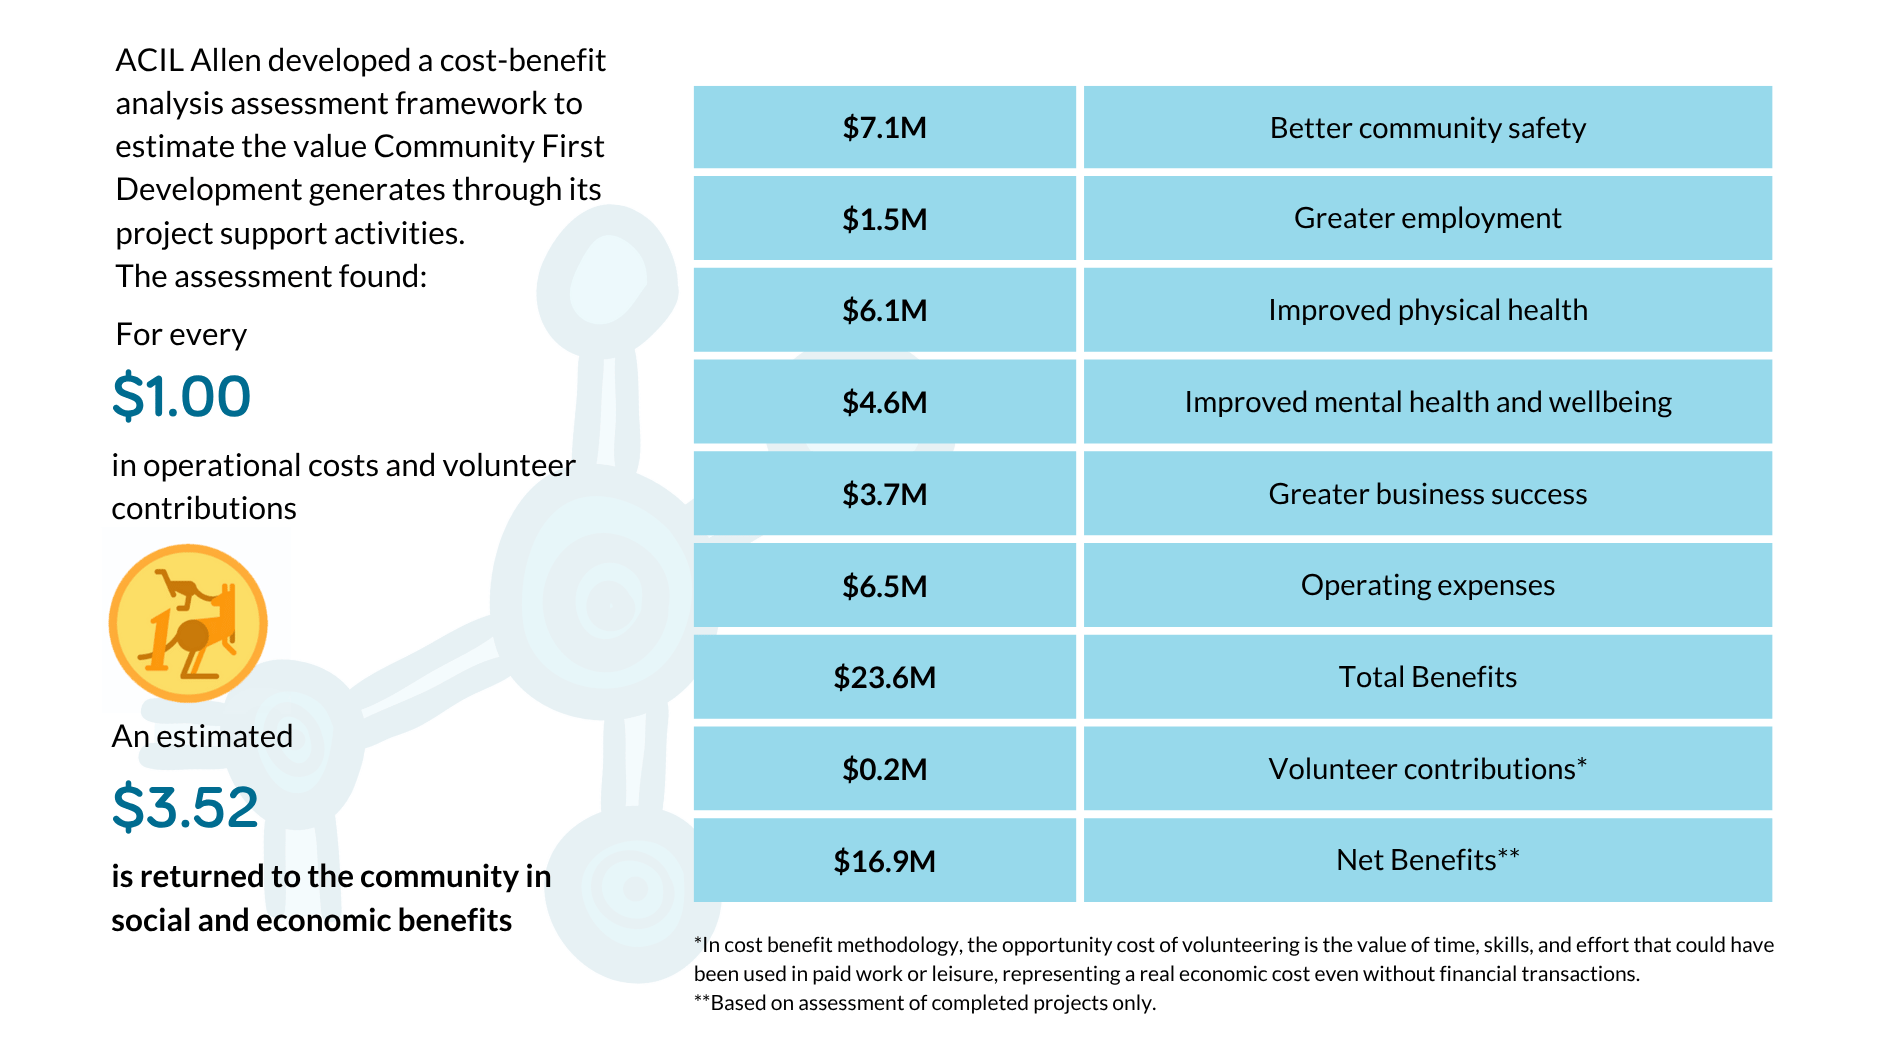
A statistical infographic showing the cost-benefit analysis framework developed by ACIL Allen, with financial figures and corresponding community benefits, including safety, employment, health, well-being, and economic success, and emphasizing community returns.

Source: Community First Development Annual Report 2024-25

Our contribution to change

We asked communities how significant our contribution was to realising their goals.
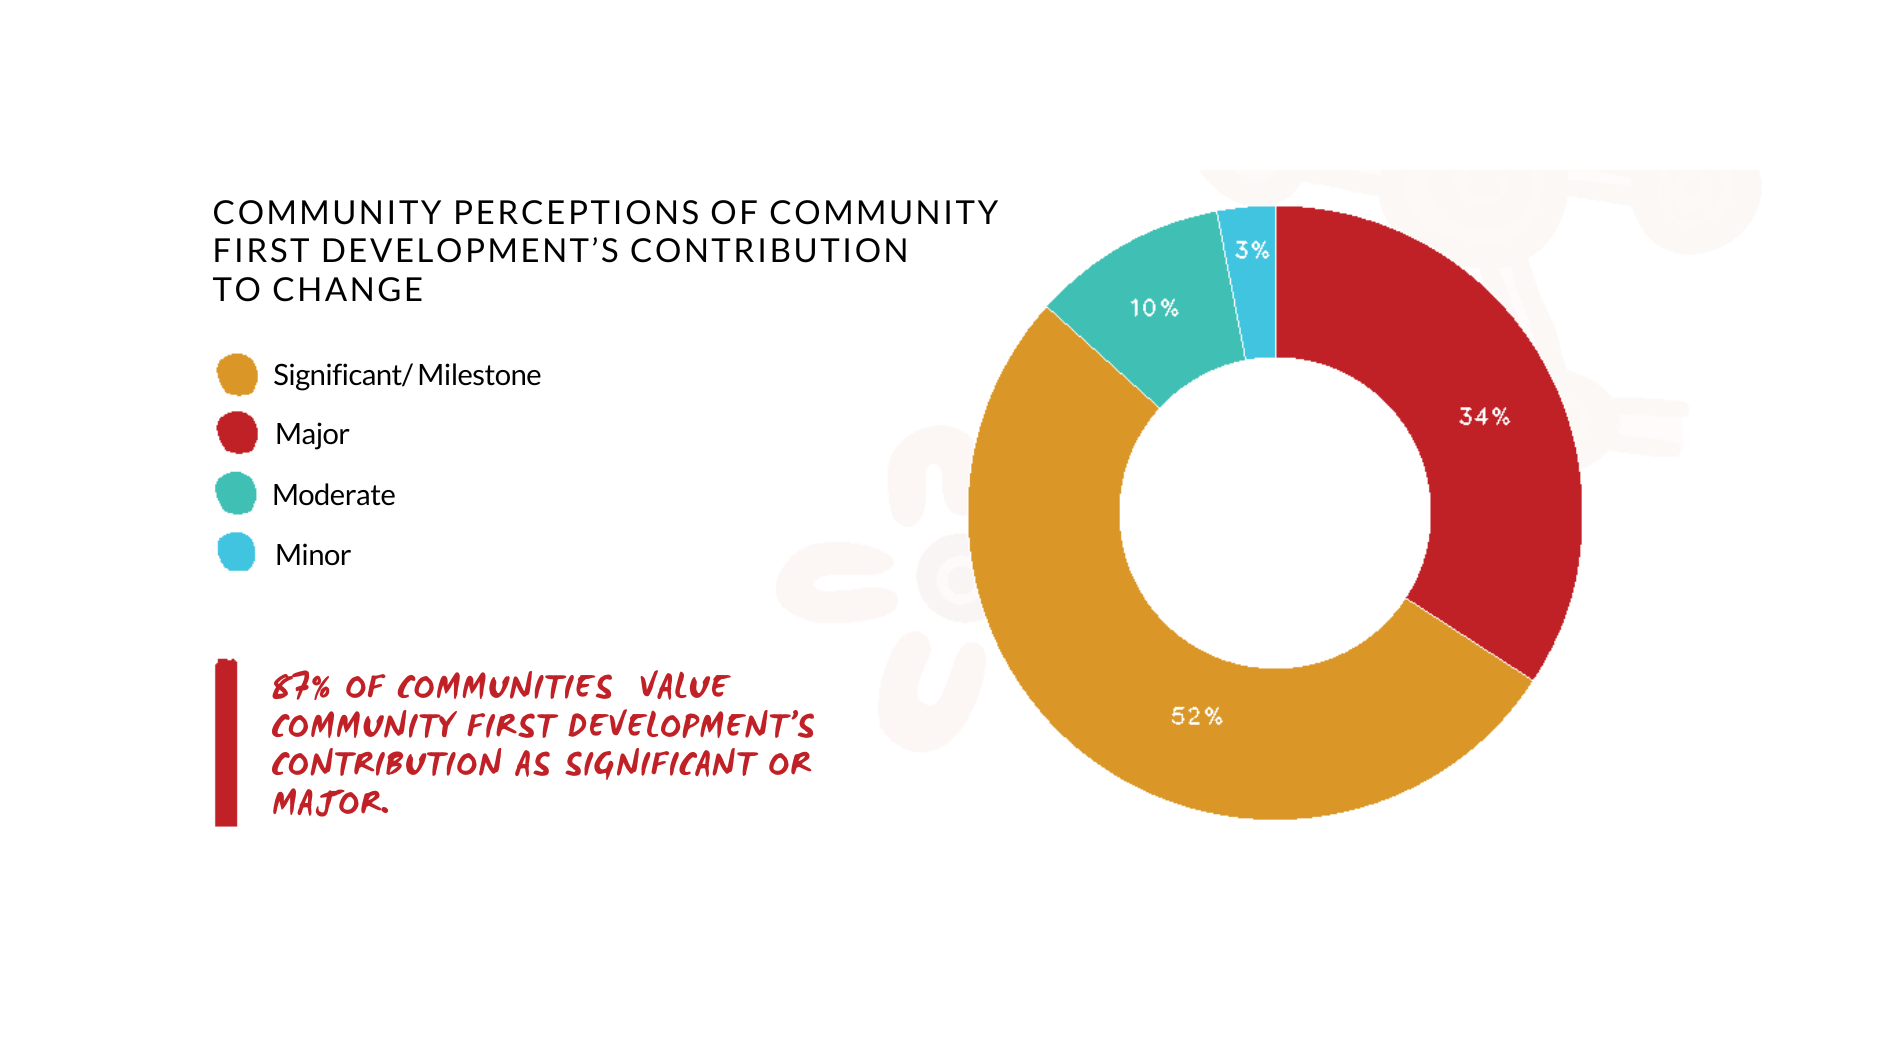
Pie chart illustrating community perceptions of community First Development's contribution to change, segmented into significant/milestone, major, moderate, and minor, with percentages and a note about community value.

Source: Community First Development Annual Report 2024-25

The communities we work with

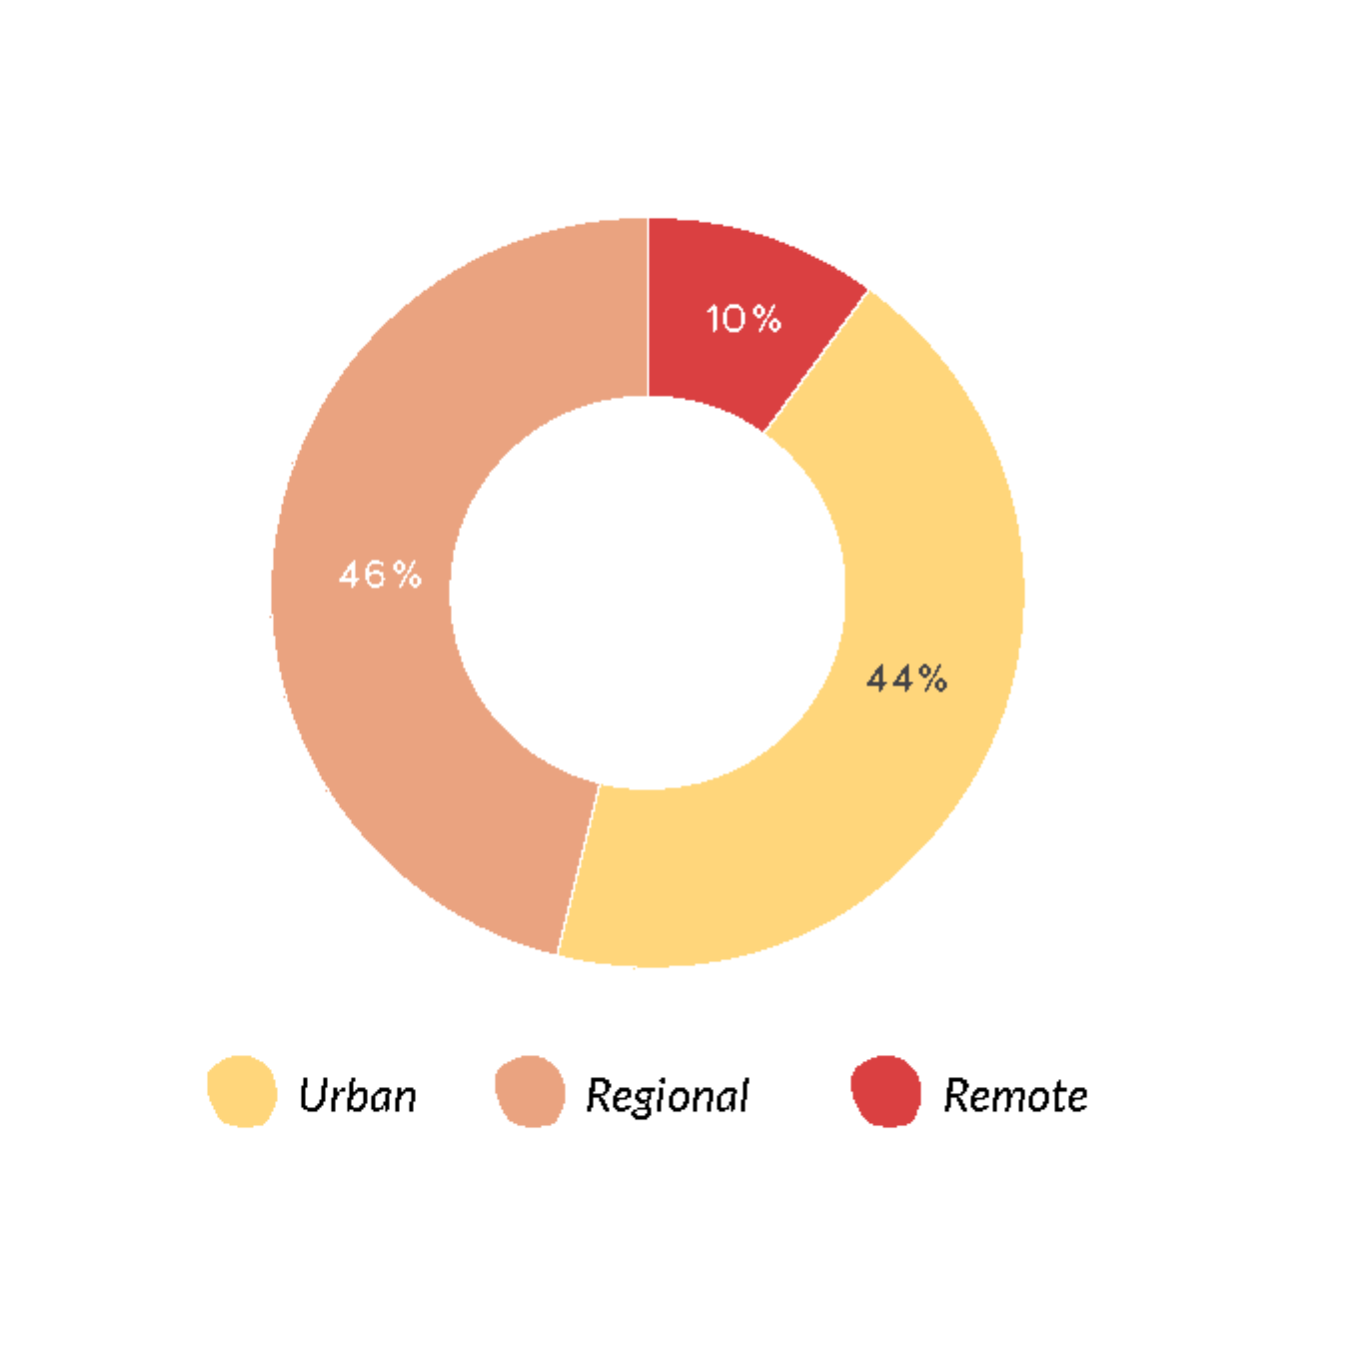
Here’s where our community partners are located (2024-25).

There are multiple community groups and projects in some locations.
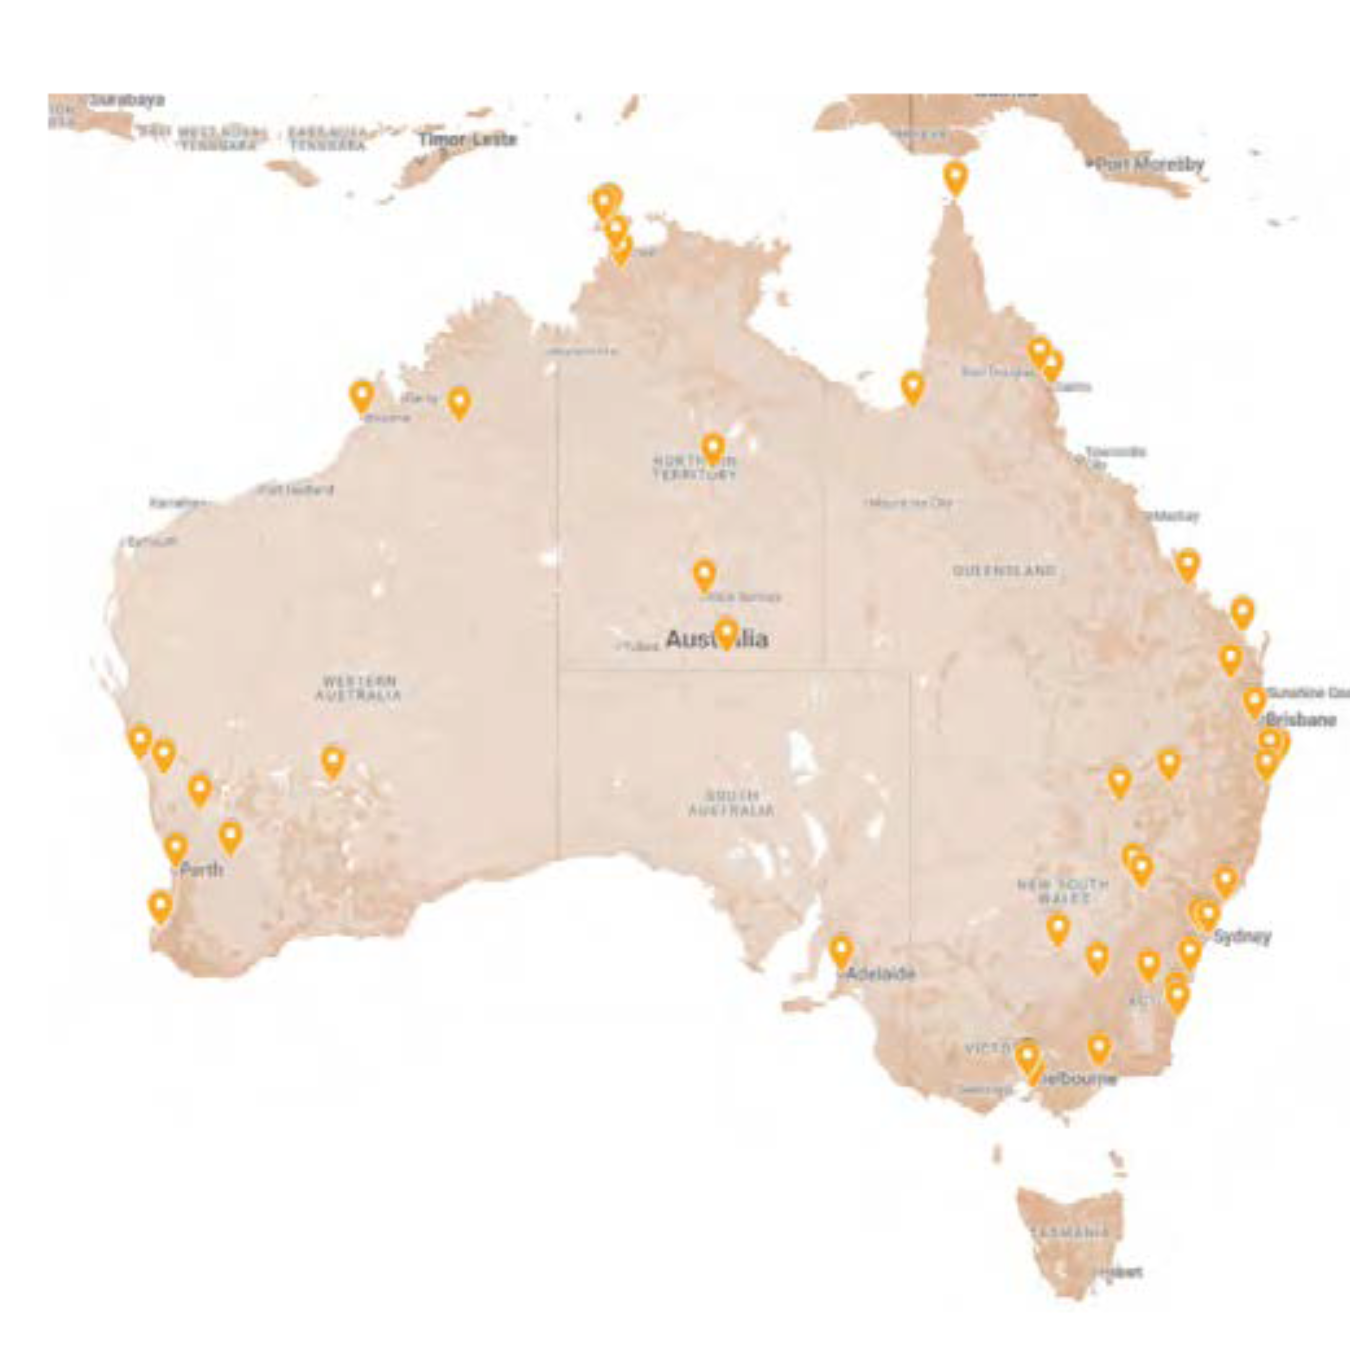
Map of Australia with orange location markers across the country.
Colorful donut chart illustrating percentages for Urban (44%), Regional (46%), and Remote (10%) categories, with a legend below indicating color codes.

Total projects by location.

Core business of communities
we work with
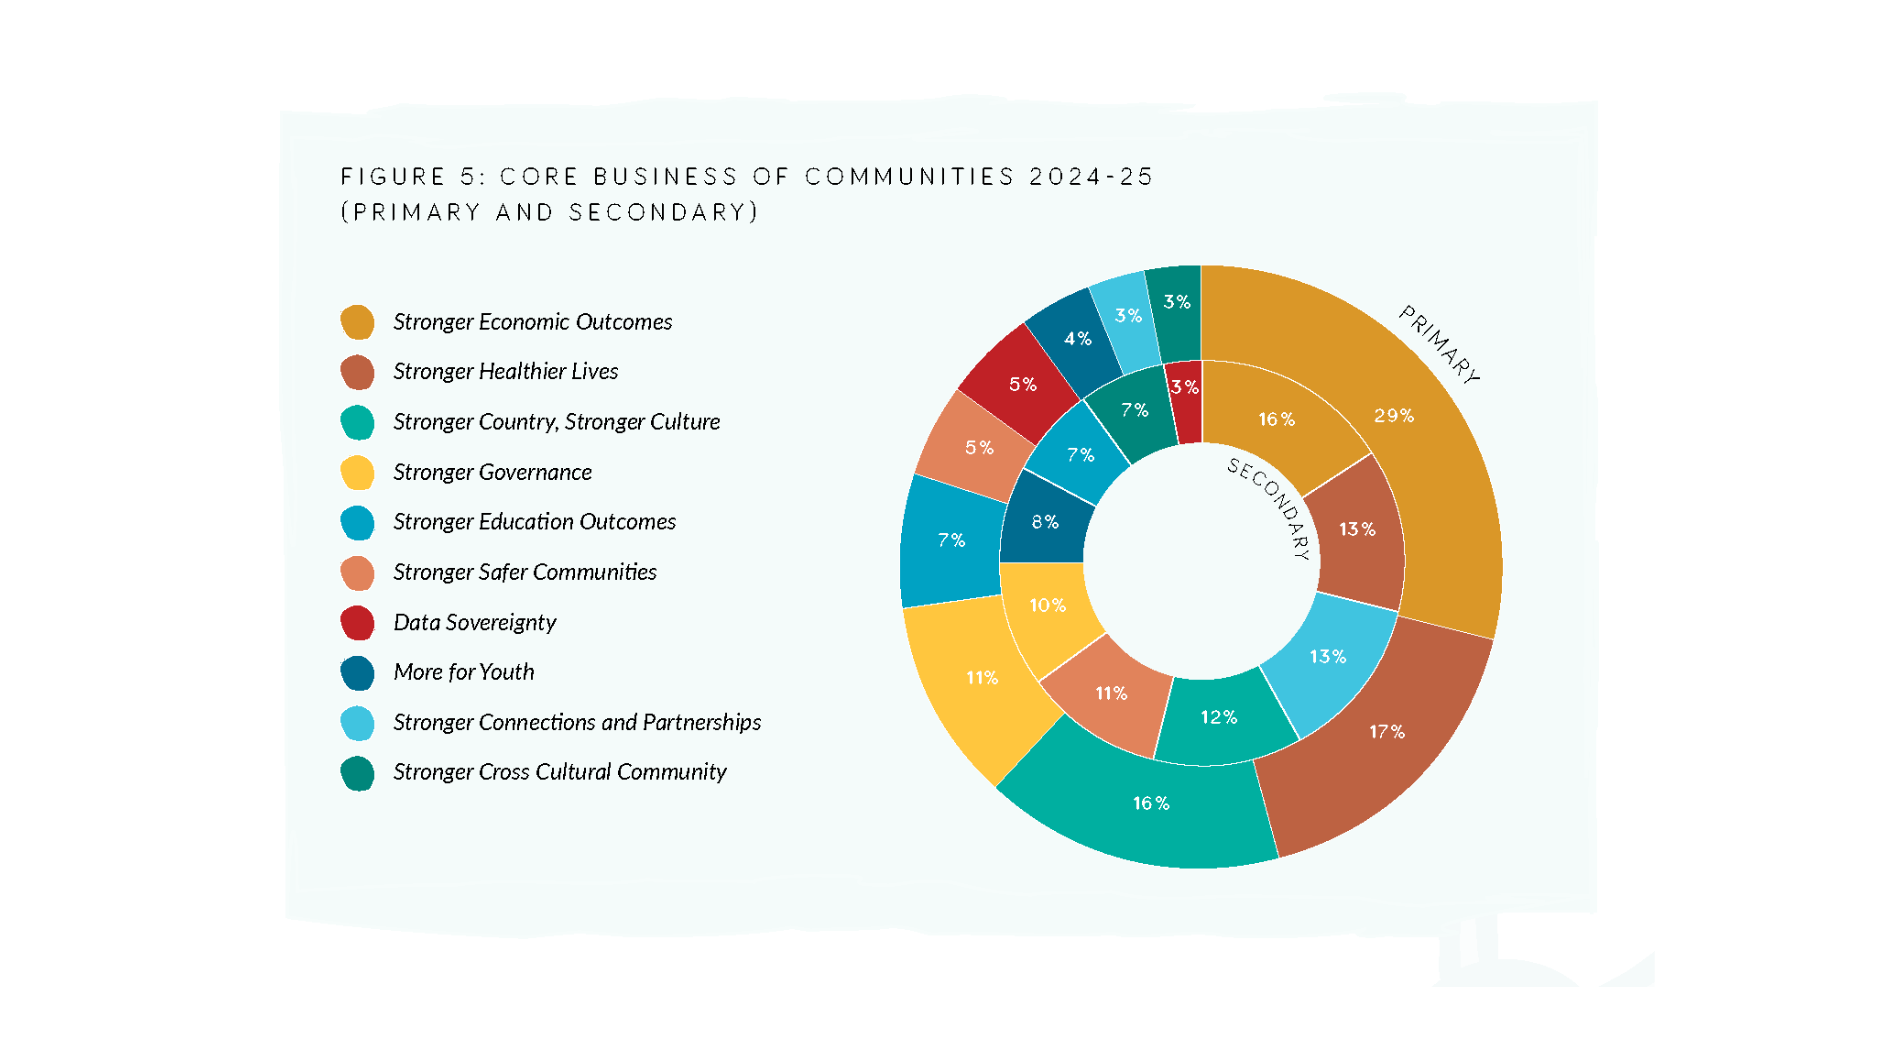
A circular diagram illustrating the core business of communities for 2024-25, divided into primary and secondary segments, with each segment color-coded and labeled with percentage values.

Source: Community First Development Annual Report 2024-25

Our impact at a glance
2024 - 2025
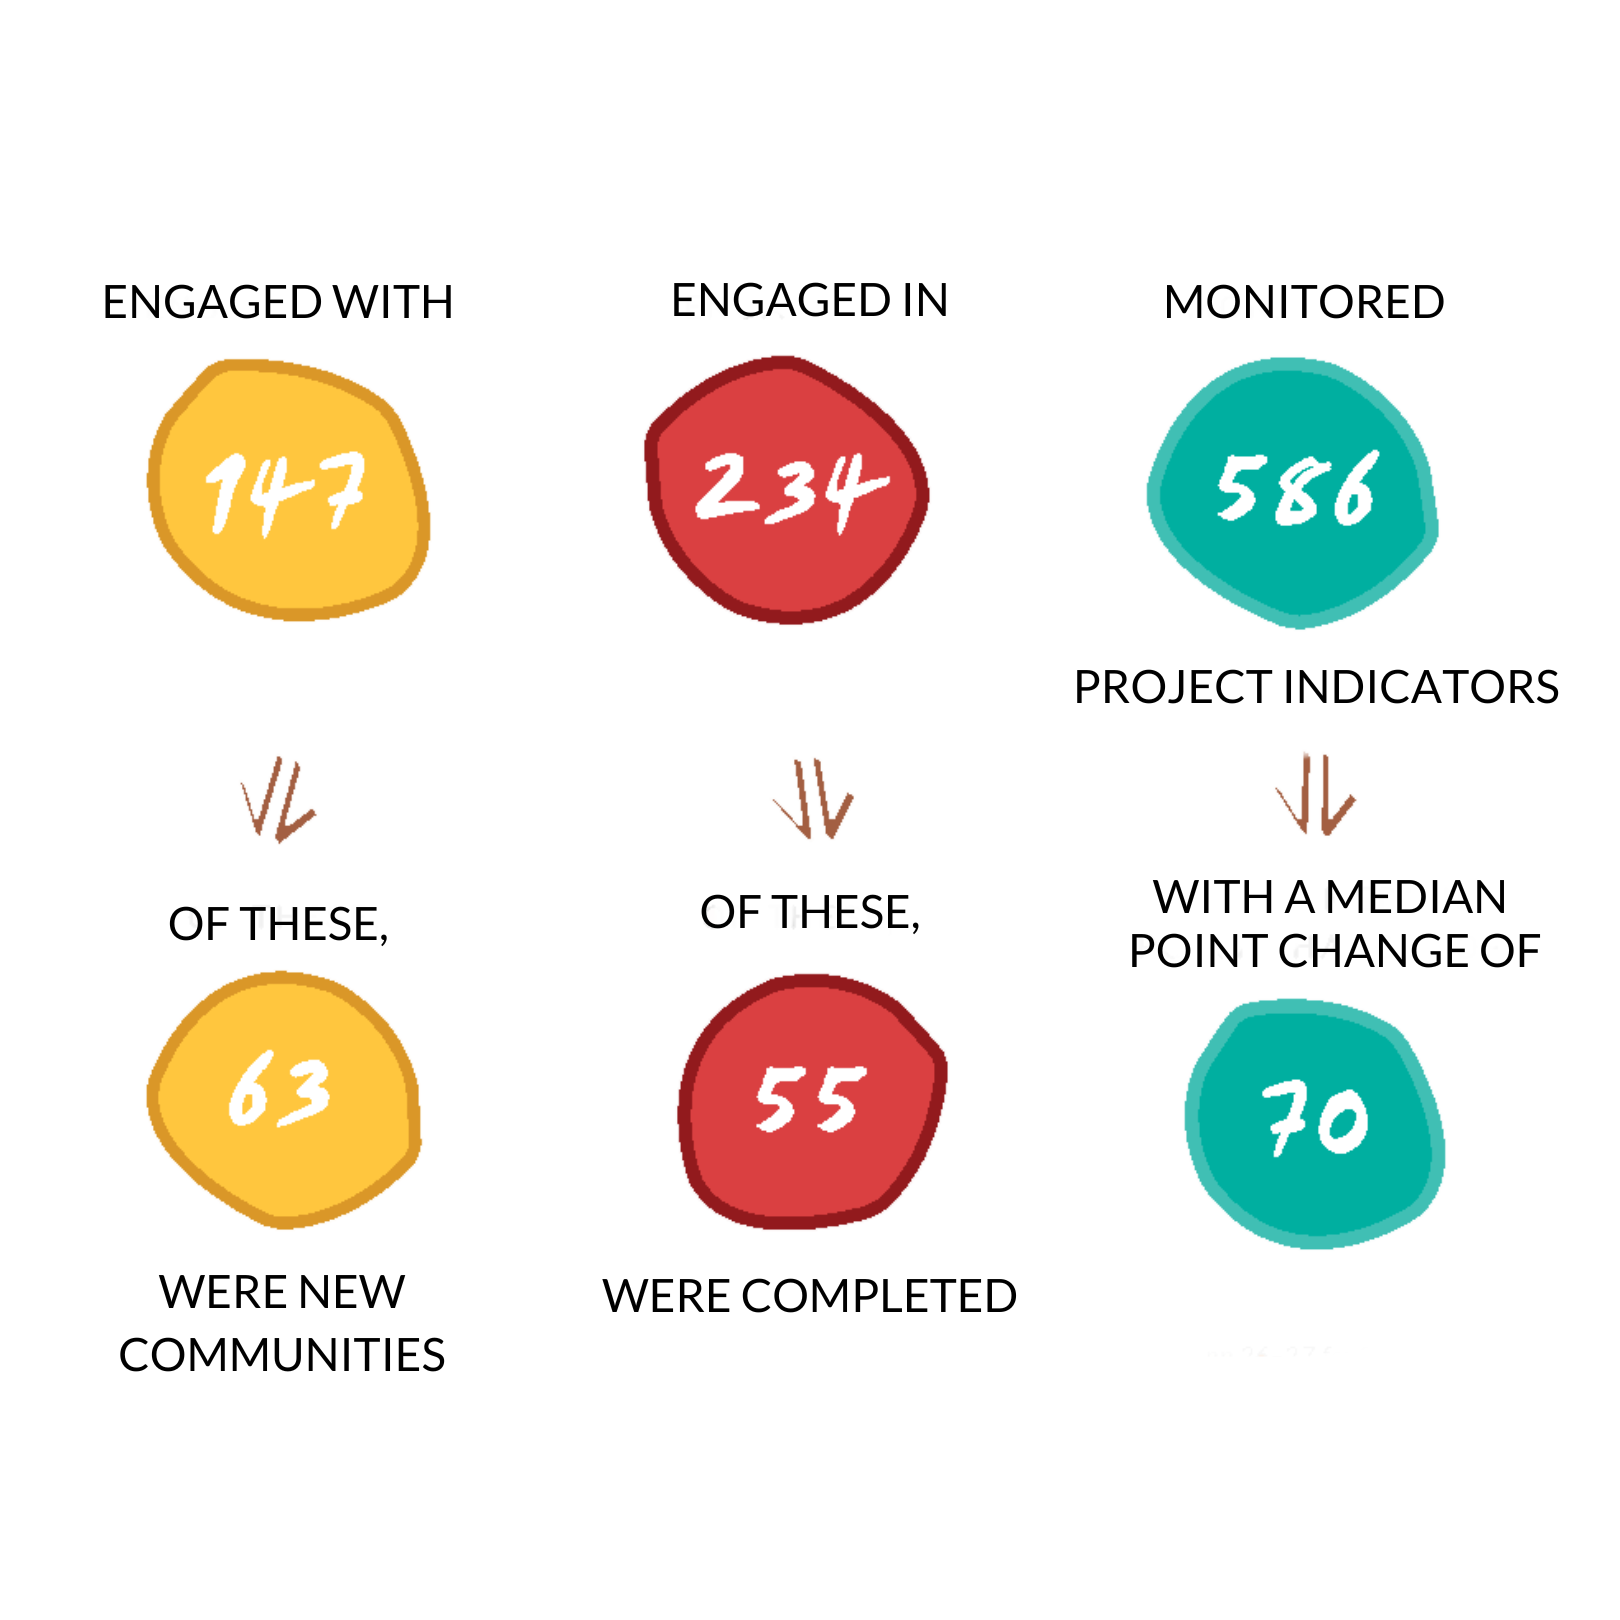
A colorful infographic showing three project indicators with numerical data and descriptions, including arrows pointing downward indicating a median point change.
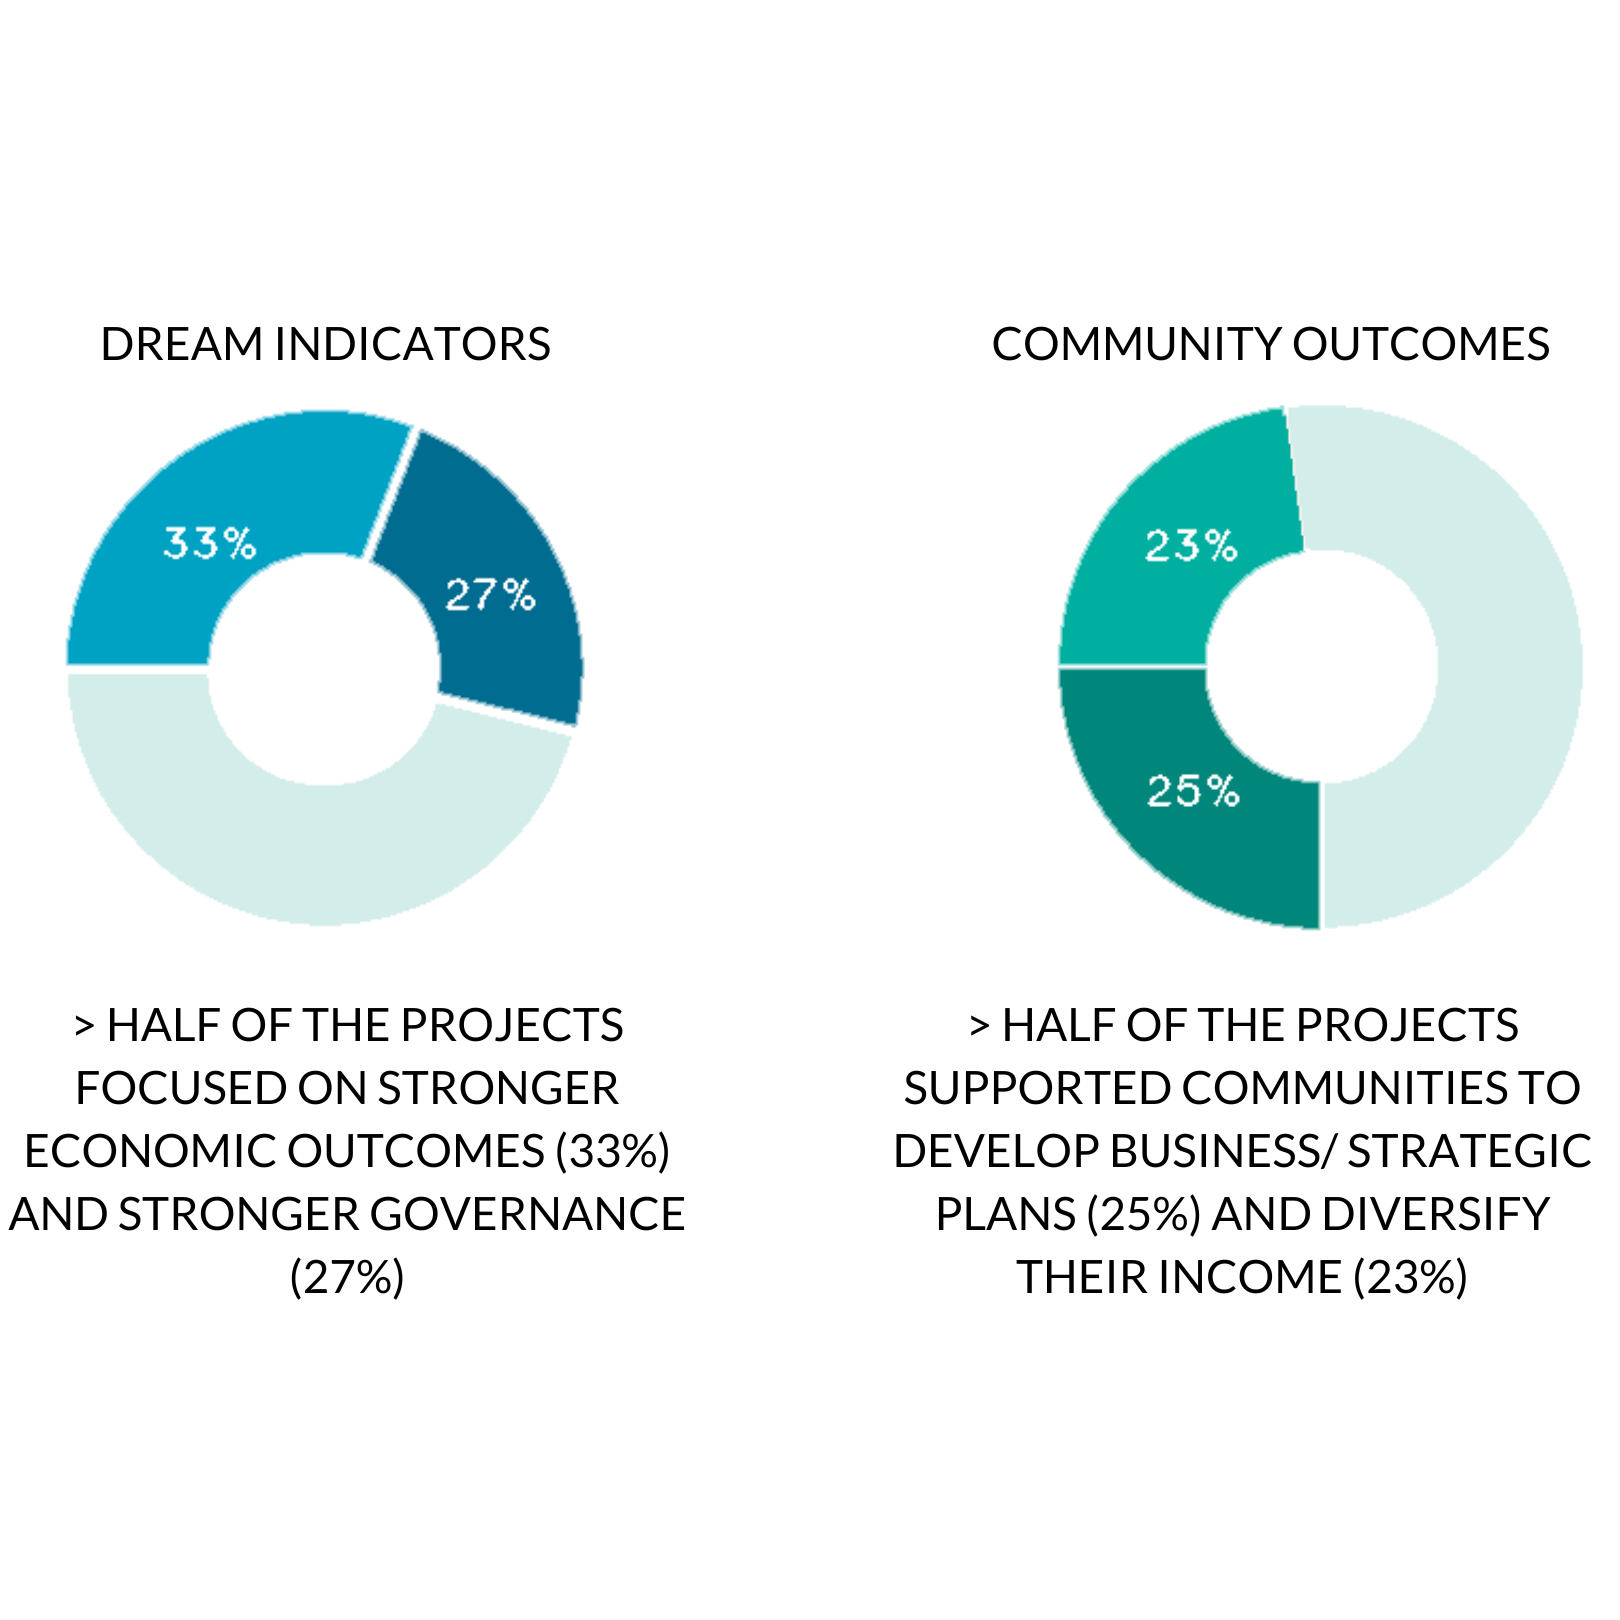
Two pie charts illustrating project outcomes. The left chart titled "Dream Indicators" shows 33%, 27%, and other segments. The right chart titled "Community Outcomes" shows 23%, 25%, and other segments. Text underneath describes focusing on economic outcomes and supporting community development.

Education and Awareness

Alongside our community and economic development, the Supporter Engagement program invites our supporters across Australia on a journey of learning and understanding.
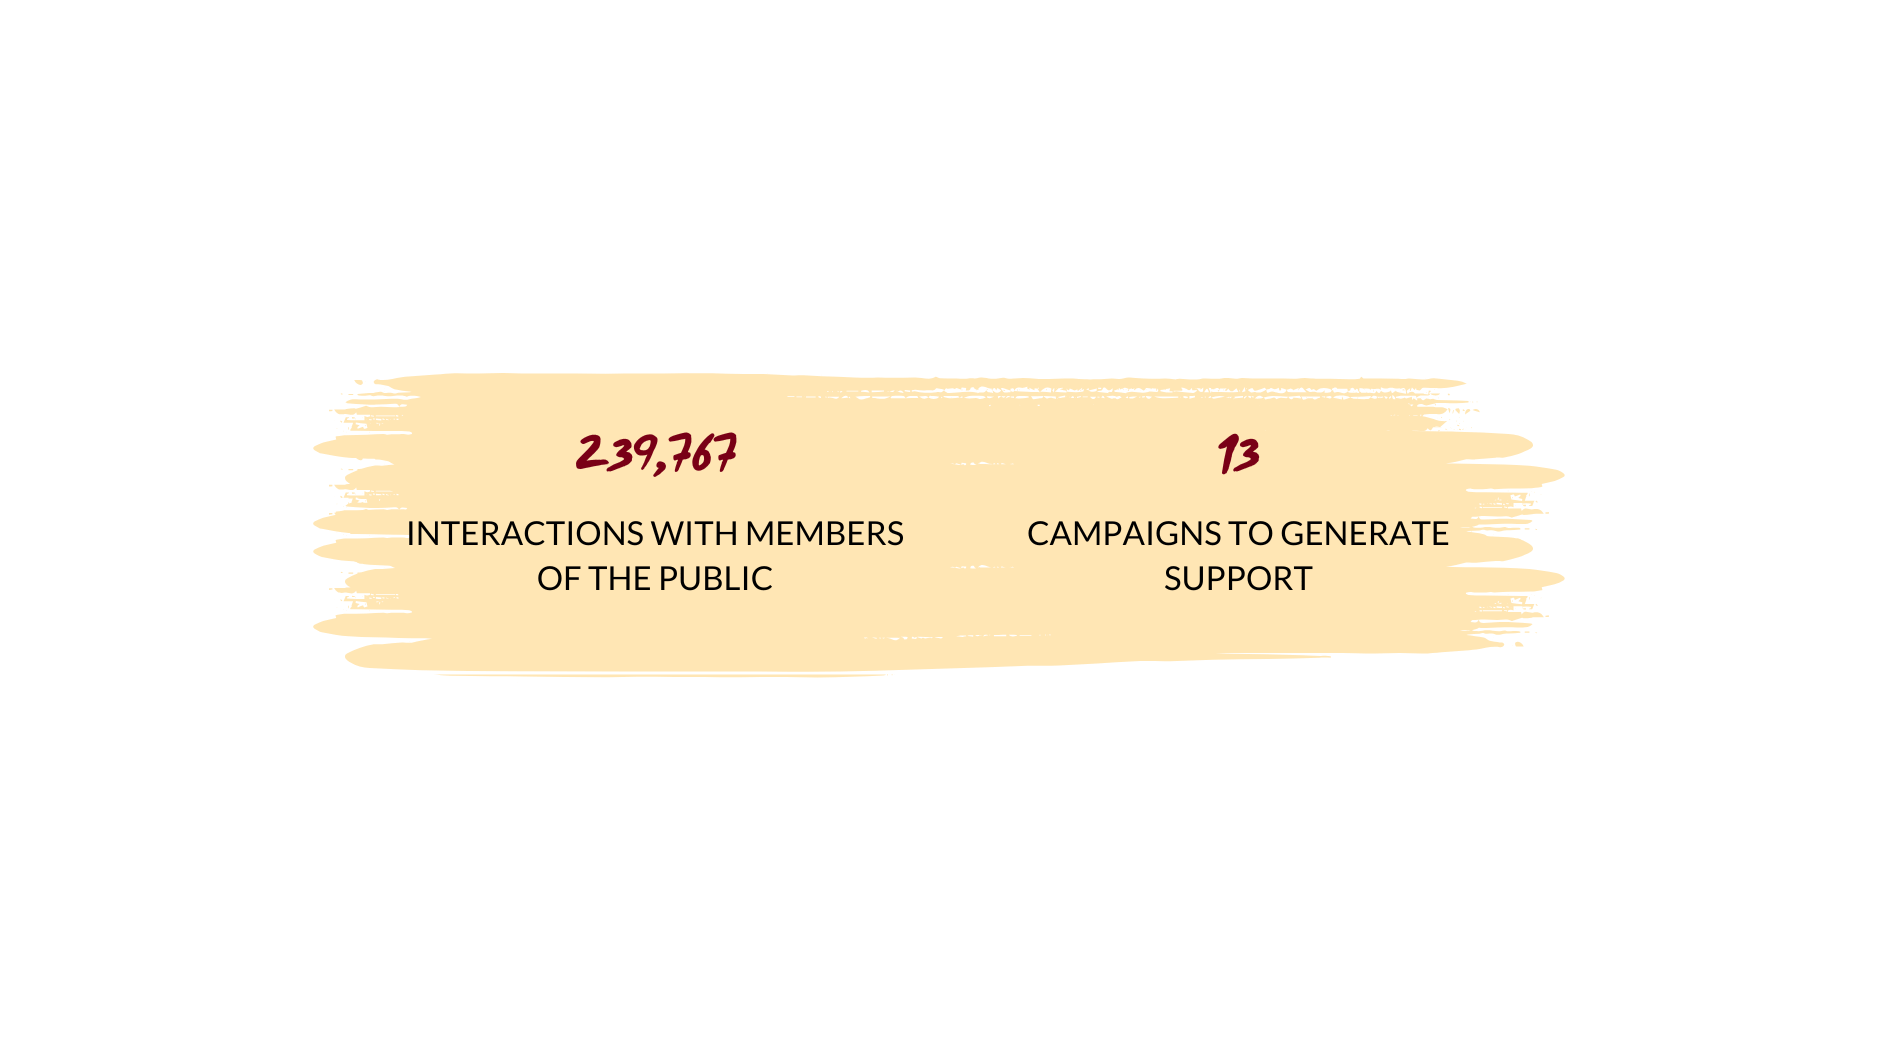
A graphic with beige background paint stroke, showing large numbers '239,767' and '13', with text 'Interactions with Members of the Public' and 'Campaigns to Generate Support' underneath each number

Our recent supporter survey showed that 89% of supporters experienced an increase in knowledge and understanding of First Peoples and their right to self-determination.

If you would like to ensure the continuation of this important work, please contact our office:

P: 1800 819 542
E: info@communityfirstdevelopment.org.au

Or make a donation.